Metrics Graph
2 min read
2 min read
2 min read
2 min read
2 min read
2 min read
2 min read
2 min read
2 min read
A Metrics Graph displays metrics retrieved from one or more Ice servers or IceBox services.
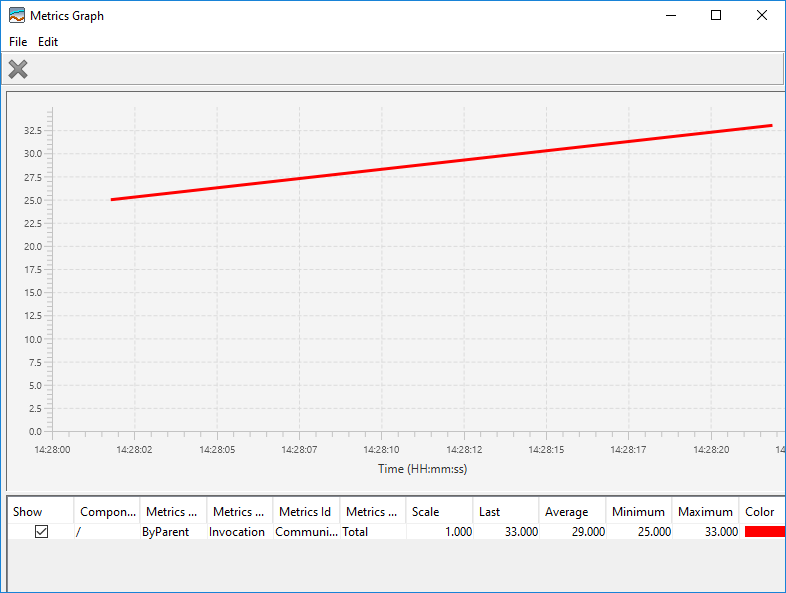
The horizontal axis corresponds to the time, while the vertical axis plots the corresponding metrics values.
Creating a New Metrics Graph
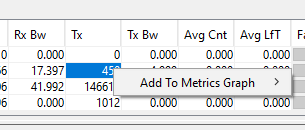
You can create a new Metrics Graph window with the File > New > Metrics Graph menu, or with a contextual menu over a metric in a Metrics View, for example:
Adding and Removing Metrics
A metric is added to a Metrics Graph with drag & drop, or through a contextual menu over this metric.
To remove a metric from a Metrics Graph, select this metric and press Delete or the  button.
Adjusting Scale and Color
You can display metrics with different scales on the same graph by adjusting the scale factor of each metric. The values plotted are the metric's values times the scale factor; the default scale factor is 1.0.
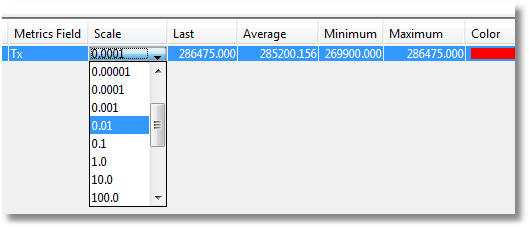
You can also change the color used to display a metric's line by clicking on the Color cell of the metric.
Metrics Graph Preferences
The File > Preferences menu of a Metrics Graph window opens a dialog that allows you to configure several properties of your Metrics Graph:
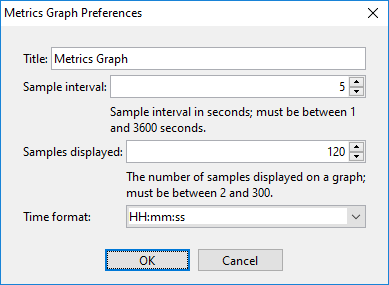
For each metric plotted in a Metrics Graph, IceGrid GUI retrieves the corresponding value every Sample interval seconds (by default every 5 seconds), and displays n values (n = 120 by default). Sample interval times Samples displayed correspond to the time period represented on a graph; by default, it is 5s * 120 = 10 minutes.